Friday, December 7, 2007

Chapter 2, Lesson 1


Welcome to Beginners Programming

Have you ever ridden on a roller coaster with a loop? Sounds fun isn’t it? But I have not rode a roller coaster with a loop. So what’s with the loop? You may ask, well it is our lesson for this chapter. Chapter 2 : Looping. Yep, were on chapter 2.


Looping


So what is looping? It is basically repeating a process over and over again. It is like having ten sit-ups a day. So everyday you have to repeat the process, 10 sit-ups. We also have the infinite loop, where we process the data without end, but we don’t want to apply it to sit-ups.


We sometimes refer to the infinite loop as “hang”. We commonly hear our friends say “My Computer Hanged” or “My Computer Froze”, other call it “Bug”, sometimes it is caused by a Virus (which repeats a process over and over, then chokes the memory of the computer).

Okay, let’s say you want to print your name 3 times on the screen, without the loop, it can be done.

Flowchart 1:


And we have a flowchart that prints 3 “John”. How about printing it 100 times? Yes, your flowchart will be looooooooong, just to print the name “John”. This is where the loop comes in. We can repeat the name 100 times using loop, so our flowchart will be just a short one. I’ll give you two exactly the same example but different logic.


Logic 1


In Logic 1, we have minimized the flowchart by using a loop, if there is a certain portion of our code block that is to be repeated a number of times.

Algorithm:
1. start
2. Initialize the variable i = 1
3. we ask if the value of i is less than or equal to 100, else go to number 7.
4. we print “John”
5. we add 1 to the variable i = i + 1 (value of i is 1, hence = 1 + 1, the value of i now is 2, hence = 2 + 1, etc….)
6. repeat number 3.
7. end of the program

We can also draw the flowchart this way:


Logic 2


Logic 1, we ask first before we print the name
Logic 2, we print the name before we ask


Either way we still get the same result. So when making a flowchart, the path to take or the flow will all depend on your logic on how you solve a particular problem.

You can also control the looping, and it will be your decision as to when the program will end. Yes, you wish is the computer’s command.


Same as Logic 2, but with interaction with user.


Algorithm:

1. start
2. We initialized the value of Reply to space or blank
3. we print “John”
4. we ask if the user wants to print it again, user will enter either Y or N
5. get the user input
6. test if the input is Y or N, if Y, we repeat process number 3, else we go to number 7.
7. end of the program.

And there you have it. The flow terminates only when the user inputs ‘N’ and is assigned the variable Reply.

We can apply the logic to chapter 1, lesson 4, problem 5.

Original flowchart


Modified flowchart:


The original flowchart has 3 known Quiz results, compute and print for the average grade and stop, but the modified flowchart (as you noticed, I grouped similar items to one symbol), the 3 quizzes are unknown, so we let the user to input the values for the quizzes, then compute and print the average grade. The user now can repeat the process over and over, and exit or terminate the program when needed.

- End of Chapter 2, Lesson 1

Tuesday, November 27, 2007

Chapter 1, Lesson 6

Welcome to Beginners Programming.

However you think about it, our life is like a program, we have a pattern in which we should follow each and everyday. Some path that we should take whenever we face life’s choices, but then again, we still follow the program whichever path we take. No, its not the same pattern but it resembles what was. Let me show you a flowchart, just to let you see what I am trying to imply.


As you can see, you are trapped in a pattern which you cannot deny. Isn’t that what you are doing? Or if you are a student, you would follow this flow:


But it looks the same, the flow is the same. Oh you’ve noticed eh? The routine is different but the pattern is the same. Think about it, we are all locked into a flow, whatever pattern it may be, but it goes around and around everyday. Take this example:


Can we change it? Maybe. Can we escape the routine? Hmm we could, but it will still be another routine. Can we break the routine? I don’t know. Ask the experts about this. Now I’m pulling you back to our pattern, the problem solving and flowchart making.

Our lesson is to create a complex flowchart, but of course we need a problem so it will be more specific.

Problem 1:
Input 3 numbers and draw a flowchart that would determine which number is greater, and display the number on the screen.

Variables needed:
1. A, B, C

What does the problem want?
1. Determine the larger value
2. Display the larger value on the screen.

Flowchart


Yep, its like building a house. Can you follow the flow? Let us trace the flowchart.

Possible 1:

A=8, B=5 and C=3

1. it first get data from keyboard
2. then it asks if A > B (8 > 5)
3. true, it asks if A > C (8 > 3)
4. true, it prints the value of A (8) on the screen

Possible 2:

A=5, B=10 and C=3

1. it first get data from keyboard
2. then it asks if A > B (5 > 10)
3. false, it asks if B > C (10 > 3)
4. true, it prints the value of B (10) on the screen

Possible 3:

A=8, B=5 and C=18

1. it first get data from keyboard
2. then it asks if A > B (8 > 5)
3. true, it asks if A > C (8 > 18)
4. false, it asks if B > C (5 > 18)
5. false, it prints the value of C (18) on the screen

Possible 4:

A=5, B=10 and C=11

1. it first get data from keyboard
2. then it asks if A > B (5 > 10)
3. false, it asks if B > C (10 > 11)
4. false, it prints the value of C (11) on the screen

So that’s about it. We have seen how our flow of logic makes it through each possibility. But what if they have the same value? Yes what about it? Then we create a new flowchart to satisfy the need.

Revised Flowchart


Take note of the red colors, that’s the changes I made to satisfy the problem when one or more inputs are equal.

What can you get out of making a flowchart?

1. Communicate: Flowcharts are better way of communicating the logic of a system.
2. Analyze Effectively: Problem can be analyzed in more effective way by following the flow.
3. Good documentation: Flowcharts serve as a good program documentation, which is needed for various purposes.
4. Easy coding: The flowcharts act as a guide or blueprint during the systems analysis and program development phase.
5. Problem Identification: The flowchart helps in identifying the problem as it progress.
6. Easy Maintenance: The maintenance of operating program becomes easy with the help of flowchart. It helps the programmer to put efforts more efficiently on that part

What the limitations of using the flowchart?

1. Complex logic: Sometimes, the program logic is quite complicated. In that case, flowchart becomes complex and clumsy.
2. Alterations and Modifications: If alterations are required the flowchart may require re-drawing completely.

I guess that’s it for now. See you in our next lesson.

-End of lesson 6 Beginners Programming

Monday, November 26, 2007

Chapter 1, Lesson 5

Welcome to Beginners Programming.

Did you answer the problem I left you at lesson 4?

Lesson 4, Problem 3
Draw a flowchart that would input the name, age and gender of a person, print “Hello” if age is less than or equal to 59, else “Hi”, and print also the name.


Flowchart:

Our lesson now is to analyze the word problem. Firstly, we must determine what the problem wants, what the given values are, what are we looking for, what is the formula (for computations if any), and what it want to display. Let’s try an example problem.

Problem 1:

Given the radius of 8.4, compute for the area of the circle, and print out the radius and the area of the circle on the screen.

What does the problem want?

1. compute for the area of the circle

2. display the radius and area to the screen


What is given?


1. radius=8.4

2. PI = 3.1416 (constant)

How to we compute for the area of the circle?


Formula: PI * radius2

PI = 3.1416


What are the variables needed?

1. PI

2. radius

3. area

Now with this information what we have, we can now draw a flowchart out of it.

And there you have it.

Problem 2:

Draw a flowchart that would input three (3) numbers, compute for the sum, average and product. Display the sum, average and product on the screen.

What does the problem want?

1. Compute for the sum of the 3 numbers

2. Compute for the average of the 3 numbers

3. Compute for the product of the 3 numbers

4. Display the sum, average and product on the screen.

What is given?

1. None

Where do we get the values of the three numbers?

1. By input (from the user)

What are the formulas needed

1. sum = x1 + x2 + x3

2. average = sum / 3

3. product = x1 * x2 * x3

What are the variables needed?

1. Sum

2. Average

3. Product

4. N1, N2, N3 (for the 3 numbers)

Now we are ready to draw a flowchart. (You can use a pencil and paper)

And Walla! Another flowchart made.

Are we feeling the flow now? I hope you do, because it will be your ammunition to creating an actual computer program, well at least it will be your basis and guide, an overview as to how your program will flow. We will try a flowchart with a decision.

Problem 3:

The XYZ Manufacturing Inc., is giving each employee a year end bonus. If the employee salary is <>= 1000, the bonus is 1000. Draw a flowchart that would compute for the employee’s bonus and display the employee total salary.

By this time I assume that you already understood how to understand the word problem, define the variables to be used, and the flowchart making techniques. I am trying my best to make it as easy as possible for you. And if you do have questions and or comments, it is very much welcome.

Next lesson would be a more complex flowchart.

-End of lesson 5 Beginners Programming

Sunday, November 25, 2007

Chapter 1, Lesson 4

Welcome to Beginners Programming

Before we go on, let’s take a little peep at variables. What are variables? A variable is a term given to a thing, or a certain value, that may change. In mathematics, a variable often represents an "unknown" quantity that has the potential to change, in computer science, it represents a place where a quantity can be stored.

Example:
X = 100
FirstName=”John Doe”
Sum = 1+1
Average = 300/5

Quiz1=3, Quiz2 =5, Quiz3=5
This_is_another_Average = (Quiz1+ Quiz2+ Quiz3)/3

Variables can be any letter or number but it cannot start with a number. Numerous tutorials or info about variables can be found over the internet nowadays, but we will stick on the basics.

The relational operator

= Equal to
> Greater than
<>= Greater than or equal to
<= Less than or equal to <> Not equal to

The mathematical operator
+ addition
- deduction
* Multiplication
/ Division


Are you ready?

Flowchart

During my school days, we actually had 1 course for flowcharting; we did not get to use the computer until we finish the flowcharting course. It is somewhat frustrating not to be able to use the computer but hey, when the time came, computer programming is not a problem anymore. For beginners, flowchart is essential because you can see the flow of the program before making the actual code. For now we dig ourselves with flowcharts. I’m sure every programmer knows about this but hey, I’m assuming you are a beginner, so here we go.

Firstly you have to memorize the basic flowchart symbols as seen in Figure 1 in Chapter 1, Lesson 1, so you will know what the symbol is for and can interpret what is going on with the flow of your program.

Problem 1

Draw a flowchart that would find the sum of the two numbers 5 and 7. Display the sum

Figure 1:


Let’s try to put a variable, and apply some rules. Initialize all variables.

Figure 2:


As you can see, in figure 1, we just added the two numbers and placed the result in a variable called Sum, then we print it on the screen, however, in figure 2, we created 3 variables , X, Y and Sum.


We let X=5 , Y=7 and Sum = 0. Then we compute for the sum.


Either way, we produce the same result, we printed out the Sum of the two numbers. So now the question will be, what if X and Y is unknown , and we let the user / operator decide what number to be computed, then we have problem 2.

Problem 2:

Draw a flowchart that would input 3 numbers. Find the sum of the 3 numbers and print the sum.

Figure 3:


We have initialized 4 variables, the X, Y, Z and Sum. Then we ask the user to input or enter a number for X, Y and Z.


And the rest is history. Let’s try getting the average of the 3 numbers.

Problem 4:

Draw a flowchart that would input 3 numbers. Find the sum of the 3 numbers, compute for the average and print the sum and the average.

Figure 4:


In the initialization phase, we added 1 variable called Average. , at the processing, we added the computation for average (Average = Sum / 3). Then we added a print symbol that prints the average.

There. Very easy isn’t it? Its easy to draw, its easy to read, and its easy to follow. Let’s try a problem which is closer to reality.

“To be or not to be! “

Decisions. We encounter decision making almost 95% of our activities in life, what we eat, drink, do, and etc. We will also apply decision making in flowchart. We will modify the first flowchart I created in Lesson 1.

Problem 5

Given the 3 quiz grades of the student, Quiz1: 80 , Quiz2: 82, Quiz3: 78. Draw a flowchart that would compute for the average grade. Display your answer, and print “Passed” if the average grade is greater than or equal to 80, else print “Failed”.

Solution (Flowchart):


As you can see, the hexagon initializes the variables to be used in the entire flow.


We have computed for the sum of the three quiz grades and the average:


Or we can do this and still get the average:

Average = (Quiz1 + Quiz2 + Quiz3) / 3

The open and close parenthesis is used to group the 3 quizzes then divided by 3 to get the average grade. Either way we still get the result.

The diamond is where we determine if the computed average grade is greater than or equal to 80.


the flow then branches out, one on the left if it satisfies the average >= 80, else it branches at the bottom of the diamond, and prints the desired output, depending on the average grade that was computed. >= 80 prints “passed” , “failed” if <>

Problem 6

Input the Name and Gender of a person. Print the Name and “You are male” if gender is ‘M’ else print “You are female”.

Solution (Flowchart):


Again, we initialized the variables needed, but this time we get our data from the keyboard (user types in the name and gender), then test if the inputted gender is “M” for male or “F” for female. If male then we print “You are male” on the screen else “You are female”.

Are you up to solve the next problem? Let’s try:

Problem 7

Draw a flowchart that would input the name, age and gender of a person, print “Hello” if age is less than or equal to 59, else “Hi” and print also the name.

It’s very simple, just follow the previous flowchart examples.

Well that’s it for now.


-End of lesson 4 Beginners Programming

Saturday, November 24, 2007

Chapter 1, Lesson 3

Welcome to Beginners Programming.

A bit of c language, I'm just going to give you an idea what a C program looks like, but our C language will be on the later chapters, for we are going to dig first the flowchart. Well you can also skip to lesson 4 if you like.

Our lesson now is to display a STRING somewhere on the screen. Well, we can use escape characters but I’m going to use the gotoxy function on our tutorial.

Whenever I say “hello world!”, I am also referring to alphanumeric (0-9, a-z, A-Z etc..) characters enclosed with quotes “ ”, which is also called as STRING.

GotoXY is a function or procedure that positions the insertion or cursor at (X,Y). X in horizontal, Y in vertical direction relative to the origin of the current window. The origin is located at (1,1), the upper-left corner of the window.


DOS based program has a number of characters across and down. 80 characters across (horizontal) and 25 characters in down (vertical).


Figure 1


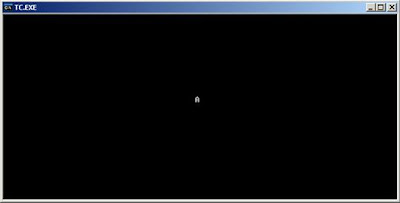
We just imagine were graphing lines during our geometry lessons. But in geometry, the (1,1) coordinates starts at the bottom left. In our case we use the top left corner as our (1,1) coordinates. Remember that x-axis is 80 characters and the y-axis is 25 characters. Now if we display a STRING at location (40,12), it simply means to position the cursor 40 characters in the X position and 12 characters in the Y position. Let’s say we print the STRING A (“A”) in the center of the screen.


Flowchart:

Figure 2


Code:


#include <stdio.h>
#include <conio.h>

int main(void)
{
gotoxy(40,12);

printf(“A”);
return 0;

}


Output :

Figure 3

1----------------------------------------40-------------------------------------------80


As you will notice, I included the conio.h file, where the gotoxy was defined.

Lets try printing a simple program displaying Christmas Tree using “*” .

Flowchart:

Figure 4

Code:


#include <stdio.h>
#include
<conio.h>
int main(void)
{

clrscr();
printf(“ * ”);
printf(“ *** ”);
printf(“ ***** ”);
printf(“ ******* ”);
printf(“ ********* ”);
printf(“***********”);
printf(“ * ”);
printf(“ * ”);
return 0;
}


Output :

Figure 5


How can we center the tree? By using gotoxy function we can center the tree on the output screen.


clrscr(); - this function is used to clear the screen.


Code:


#include <stdio.h>
#include
<conio.h>

int main(void)
{
clrscr();
gotoxy(35,3); printf(“ * ”);
gotoxy(35,4); printf(“ *** ”);
gotoxy(35,5); printf(“ ***** ”);
gotoxy(35,6); printf(“ ******* ”);
gotoxy(35,7); printf(“ ********* ”);
gotoxy(35,8); printf(“***********”);
gotoxy(35,9); printf(“ * ”);
gotoxy(35,10); printf(“ * ”);
return 0;
}


Output:
Figure 6

There you go… The tree is now centered…

There are lots of things you can do with the gotoxy like displaying a box, a triangle or something else you want. Go ahead and try some different shapes.

Next lesson, more on flowcharting...

-End of lesson 3 Beginners Programming

Friday, November 23, 2007

Chapter 1, Lesson 2

Welcome to Beginners Programming.

The first time I wrote a program was just to display “hello world!” on the screen. It was not a PC though, I cannot remember the model of that gadget but surely the label was “ATARI”. During that time, computer games was like squares and circles, it was that time of “Space Invaders” or at least it was. Those were the days, computer games today changed tremendously.

Now let’s try to make a simple program which displays “Hello World” on the screen.

Figure 1:

Flowchart: (please see lesson1 for basic flowchart symbols)


Above the graphical representation of a program which prints “Hello World!” on the screen. Now we are going to translate the flowchart using Pascal, C and C++ programming languages.

Pascal Code

C Code

C++ Code


Program HelloWorld;
uses crt;
begin
writeln("Hello World!");
end.


#include <stdio.h>
int main(void)
{
printf("Hello World!\n");
return 0;
}


#include <iostream.h>
int main(void)
{
cout
<< "Hello World!\n";
return 0;
}


The flowchart will serve as your blueprint, your guide developing a program. But as I have mentioned earlier, our world will be evolving within the C language. By the way, we will be using Borland C/C++ IDE, a DOS based program. If you do not have Borland C/C++ IDE you can download it from http://www.simonhuggins.com/courses/progbegin/c/download/index.htm

The Code:

#Include <stdio.h>

int main(void)
{
printf("Hello World!\n");
return 0;
}

Note: C language is case sensitive meaning, capital letter N is not the same as small letter n

Dissection:

#Include

Tells the processor to treat the contents of the file stdio.h as if the contents had appeared in the source program at the point where the directive appears

stdio.h

Which stands for "standard input/output header", is the header in the C standard library that contains macro definitions, constants, and declarations of functions and types used for various standard input and output operations

int main(void)

It is a special purpose function in C programs. When the program is then run or executed, the runtime environment will first call the main function otherwise it will be like some other function in the program.

{

The open curly brace indicates the beginning of the definition of the main function

printf(“Hello World!\n”);

This line calls (executes the code for) a function named printf, which is declared in the included header stdio.h and supplied from a system library. The \n is an escape sequence that C translates to the newline character, which on output signifies the end of the current line. The return value of the printf function is of type int, but it is silently discarded since it is not used by the caller. (A more careful program might test the return value to determine whether or not the printf function succeeded.) The semicolon ; terminates the statement, and the following blank line is simply ignored.

*from wikipedia

return 0;

This line terminates the execution of the main function and causes it to return the integer value 0, which is interpreted by the run-time system as an exit code (indicating successful execution).

}

The open curly brace indicates the end of the definition of the main function

Ok, so now are you ready to run the program? Running the program is just easy, like MSWord, the shortcut key for save is

CTRL+S (save document). In our case CTRL+F9 (execute the program)

You will notice that your program will just flicker or you will not notice it at all. “what then? Nothing happened…”, well something did happen, the IDE successfully executed your program.


“Really?”


If you want to see the output, press CTRL+F5.

Figure 2:

Output:


And you have your output. CONGRATULATIONS! You created your first program.

You can add as may printf as you want in your code. Go ahead try it.. explore…


printf(“this is a C program\n”);
printf(“Im gonna love this\n”);
printf(“its really fun\n”);
printf(“thank you very much\n”);

Well that’s it for now. I hope I have gotten your feet wet.

Next lesson in beginners programming, we will be learning how to display “hello world!” somewhere on the screen.


-End of lesson 2 Beginners Programming

Wednesday, November 21, 2007

Chapter 1, Lesson 1

Welcome to Beginners Programming.

First thing’s first, English is not my native language so please excuse me for my bad English.

There are two main ways to write a computer program, Graphically, by using flowcharts and by using computer programming languages, such as BASIC, C/C++, Pascal, C#, Java, etc..


But let us learn the basics of programming. The first thing you have to know is how did computer programming came into being. It all started with algorithm. Algorithm [al-guh-rith-uhm] (n.) It is a step by step instructions to solving a given task. One good example is the recipe.

Recipe for Making a Coffee

  1. Get the Coffee Jar
  2. Scoop a bit of coffee into coffee cup.
  3. Scoop a bit of sugar into coffee cup.
  4. Pour hot water into coffee cup
  5. Stir as desired
  6. Drink the coffee when ready.

We have been using algorithms all our life and we have not notice it. Like how to tie your shoe laces. When you buy your first microwave oven, or a gadget, you read the instructions on how to operate, and there you will see a series of steps (algorithm)

The algorithm is then converted to a graphic representation, using symbols interconnected with flow lines, of the successive steps in a procedure or system. It is called Flowchart.

Basic flowchart symbols

Lets do a little exercise.

Problem: Given the 3 quiz grades of the student, Quiz1: 80, Quiz2:82, Quiz3:78. Write and algorithm and draw a flowchart that would compute for the average grade and display your answer.

Algorithm:

  1. let x1 = 80, x2 = 82, x3 = 78
  2. let sum = x1 + x2 + x3
  3. let average = sum / 3
  4. display the average

Flowchart:

Another example using Perl program.

graph         { flow: south; }
node.start    { shape: rounded; fill: #ffbfc9; }
node.question { shape: diamond; fill: #ffff8a; }
node.action   { shape: rounded; fill: #8bef91; }
 
[ Lamp doesn't work ] { class: start }
  --> [ Lamp\n plugged in? ] { class: question; }
   -- No --> [ Plug in lamp ] { class: action; }
 
[ Lamp\n plugged in? ]
  --> [ Bulb\n burned out? ] { class: question; }
   -- Yes --> [ Replace bulb ] { class: action; }
 
[ Bulb\n burned out? ]
  -- No --> [ Buy new lamp ] { class: action; }

Wikipedia – Flowchart http://en.wikipedia.org/wiki/Flowchart

On the left side is the Perl Code or program in which just a series of text instructions (algorithm) to be executed. And on the right side is the graphical representation (flowchart).

As you can see, the program or series of instructions is clearly understood using graphical flowchart.

By the way, I would also inform you that the language we will be using is the C Language. And i would assume that you have a little knowledge in C Syntax. You can search the net for C Syntax.

In our next lesson, we will have simple problems, flowchart making and Create a C program translated from flowchart. If you learn this simple steps , you can create programs using any programming language you want. At Beginners Programming, we will be your guide.

-End of lesson 1 Beginners Programming